Edit chart
Loading graph
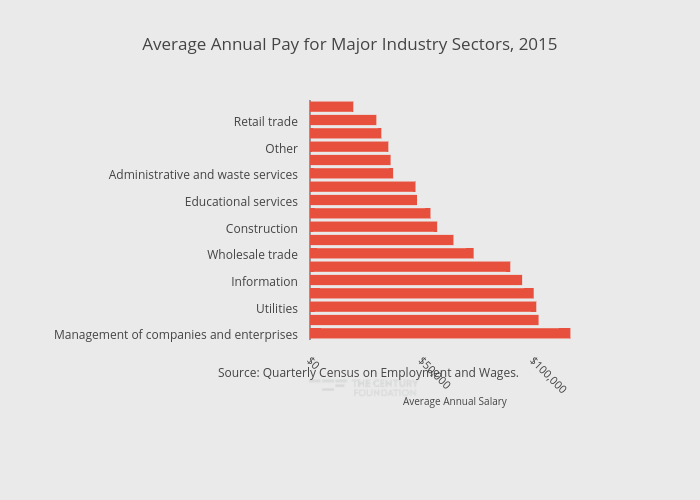
Thecenturyfoundation's interactive graph and data of "Average Annual Pay for Major Industry Sectors, 2015" is a bar chart, showing Region; with Average Annual Salary in the x-axis. The x-axis shows values from 0 to 130000. The y-axis shows values from -0.5 to 17.5. This visualization has the following annotation: Source: Quarterly Census on Employment and Wages.