Edit chart
Loading graph
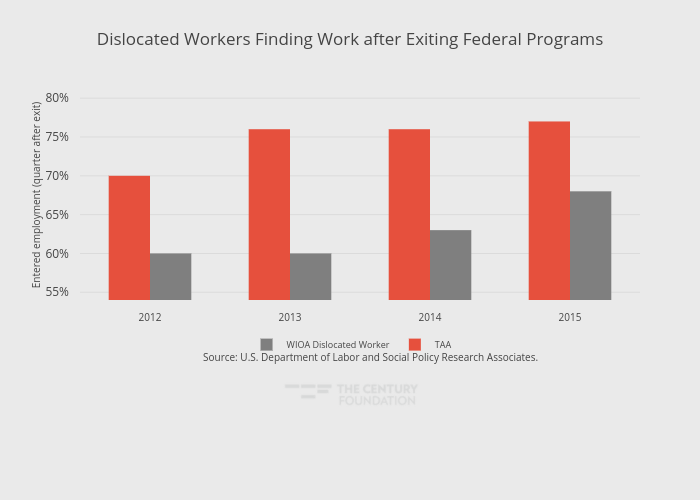
Thecenturyfoundation's interactive graph and data of "Dislocated Workers Finding Work after Exiting Federal Programs" is a grouped bar chart, showing TAA vs WIOA Dislocated Worker; with Entered employment (quarter after exit) in the y-axis. The x-axis shows values from 2011.5 to 2015.5. The y-axis shows values from 54 to 81.05263157894737. This visualization has the following annotation: Source: U.S. Department of Labor and Social Policy Research Associates.