Edit chart
Loading graph
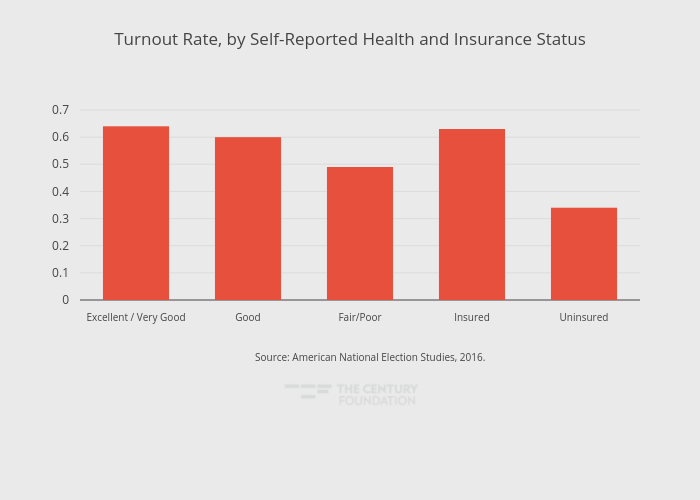
Thecenturyfoundation's interactive graph and data of "Turnout Rate, by Self-Reported Health and Insurance Status" is a bar chart, showing Annual Employment Losses (Millions). The x-axis shows values from -0.5 to 4.5. The y-axis shows values from 0 to 0.7736842105263158. This visualization has the following annotation: Source: American National Election Studies, 2016.