Edit chart
Loading graph
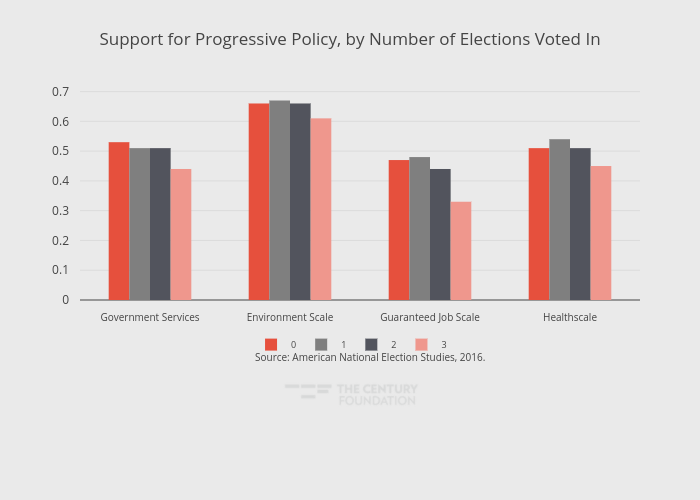
Thecenturyfoundation's interactive graph and data of "Support for Progressive Policy, by Number of Elections Voted In" is a grouped bar chart, showing 0, 1, 2, 3. The x-axis shows values from -0.5 to 3.5. The y-axis shows values from 0 to 0.7052631578947369. This visualization has the following annotation: Source: American National Election Studies, 2016.