Edit chart
Loading graph
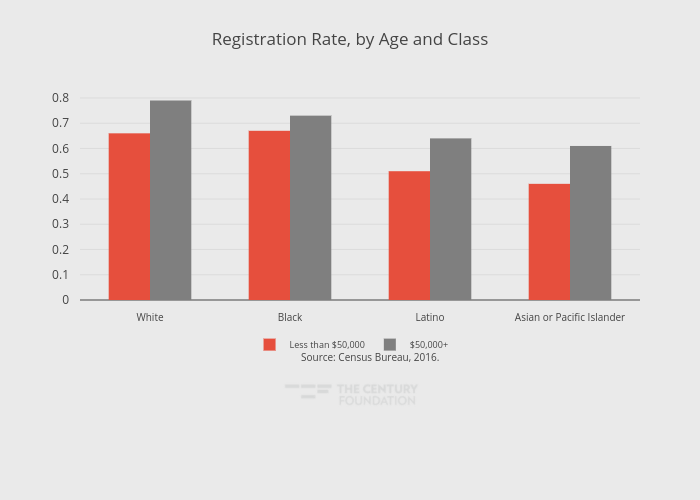
Thecenturyfoundation's interactive graph and data of "Registration Rate, by Age and Class" is a grouped bar chart, showing Less than $50,000, $50,000+, D, Less than $50,000. The x-axis shows values from -0.5 to 3.5. The y-axis shows values from 0 to 0.8315789473684211. This visualization has the following annotation: Source: Census Bureau, 2016.