Edit chart
Loading graph
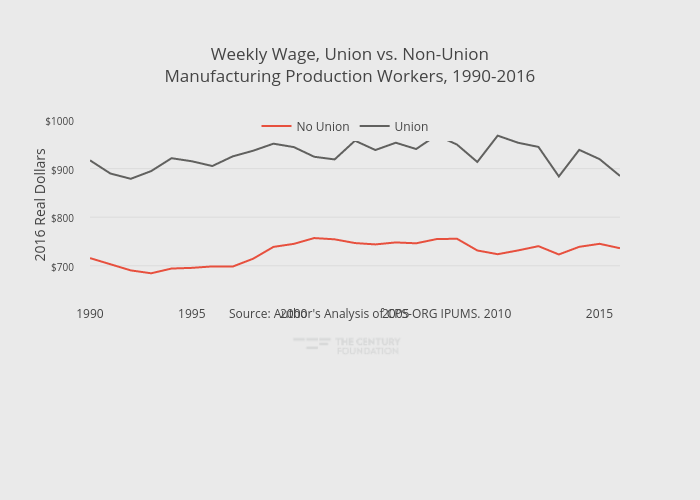
Thecenturyfoundation's interactive graph and data of "Weekly Wage, Union vs. Non-UnionManufacturing Production Workers, 1990-2016" is a line chart, showing No Union vs Union; with in the x-axis and 2016 Real Dollars in the y-axis.. The x-axis shows values from 1990 to 2016. The y-axis shows values from 650 to 1000. This visualization has the following annotation: Source: Author's Analysis of CPS-ORG IPUMS.