Edit chart
Loading graph
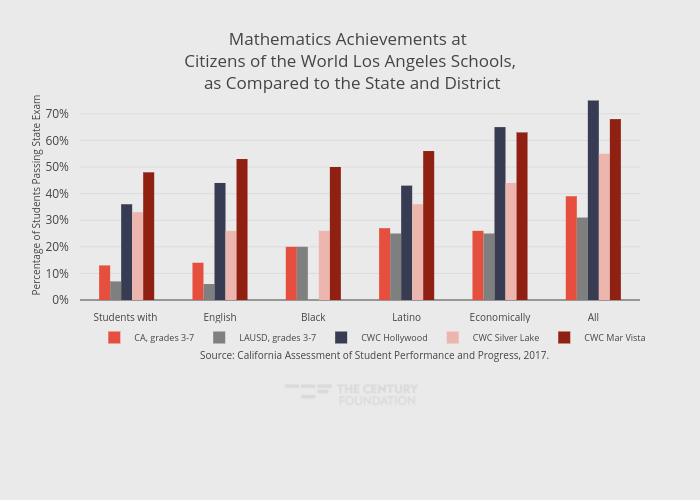
Thecenturyfoundation's interactive graph and data of "Mathematics Achievements at Citizens of the World Los Angeles Schools, as Compared to the State and District" is a grouped bar chart, showing CA, grades 3-7, LAUSD, grades 3-7, CWC Hollywood, CWC Silver Lake, CWC Mar Vista; with Percentage of Students Passing State Exam in the y-axis. The x-axis shows values from -0.5 to 5.5. The y-axis shows values from 0 to 78.94736842105263. This visualization has the following annotation: Source: California Assessment of Student Performance and Progress, 2017.