Edit chart
Loading graph
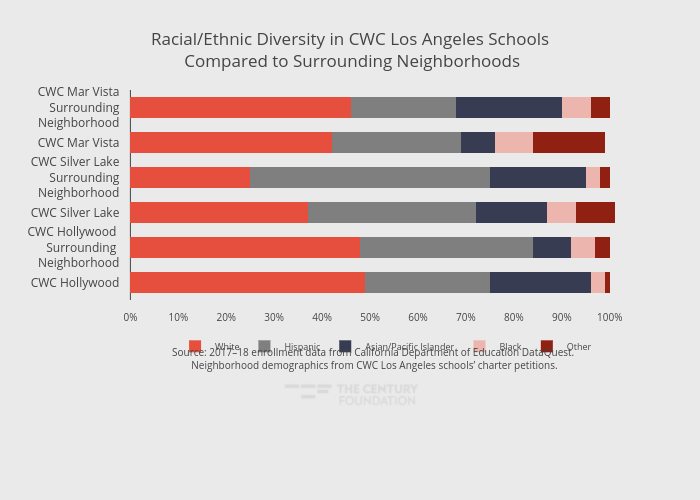
Thecenturyfoundation's interactive graph and data of "Racial/Ethnic Diversity in CWC Los Angeles Schools Compared to Surrounding Neighborhoods" is a stacked bar chart, showing White, Hispanic, Asian/Pacific Islander, Black, Other. The x-axis shows values from 0 to 106.3157894736842. The y-axis shows values from -0.5 to 5.5. This visualization has the following annotation: Source: 2017–18 enrollment data from California Department of Education DataQuest. Neighborhood demographics from CWC Los Angeles schools’ charter petitions.