Edit chart
Loading graph
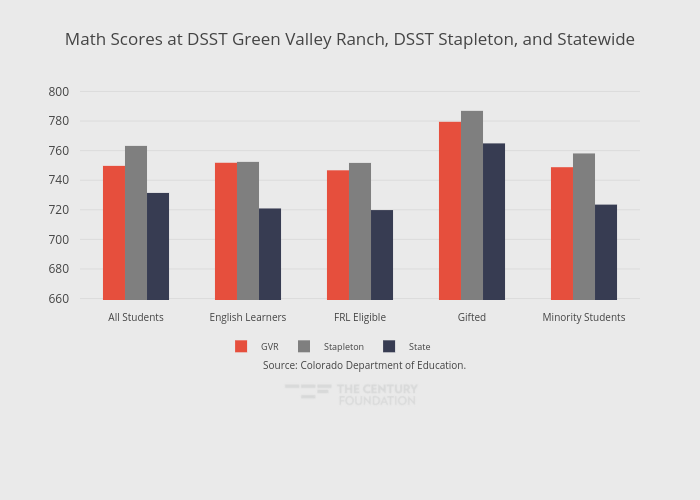
Thecenturyfoundation's interactive graph and data of "Math Scores at DSST Green Valley Ranch, DSST Stapleton, and Statewide" is a grouped bar chart, showing GVR, Stapleton, State, A, A. The x-axis shows values from -0.5 to 4.5. The y-axis shows values from 659 to 801. This visualization has the following annotation: Source: Colorado Department of Education.