Edit chart
Loading graph
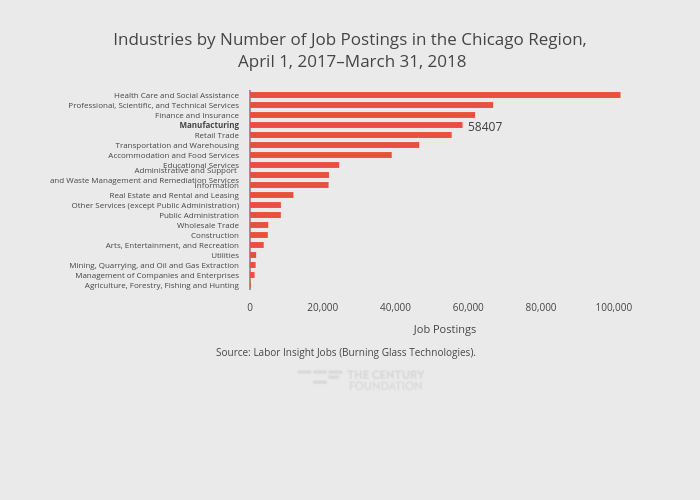
Thecenturyfoundation's interactive graph and data of "Industries by Number of Job Postings in the Chicago Region, April 1, 2017–March 31, 2018" is a bar chart, showing A; with Job Postings in the x-axis and in the y-axis.. The x-axis shows values from 0 to 107190.52631578948. The y-axis shows values from -0.5 to 19.5. This visualization has the following annotations: Source: Labor Insight Jobs (Burning Glass Technologies).; 58407