Edit chart
Loading graph
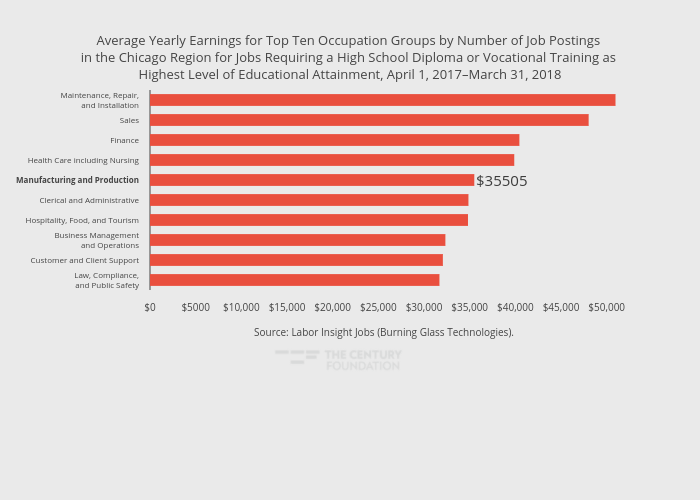
Thecenturyfoundation's interactive graph and data of "Average Yearly Earnings for Top Ten Occupation Groups by Number of Job Postings in the Chicago Region for Jobs Requiring a High School Diploma or Vocational Training as Highest Level of Educational Attainment, April 1, 2017–March 31, 2018" is a bar chart, showing A; with in the y-axis. The x-axis shows values from 0 to 53646.31578947369. The y-axis shows values from -0.5 to 9.5. This visualization has the following annotations: Source: Labor Insight Jobs (Burning Glass Technologies).; $35505