Edit chart
Loading graph
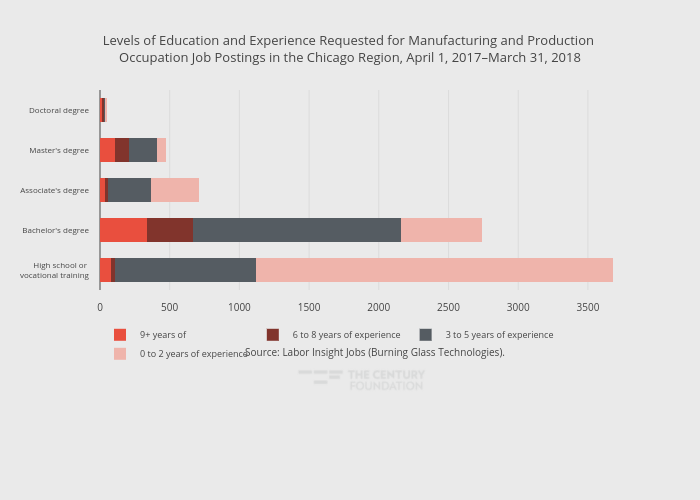
Thecenturyfoundation's interactive graph and data of "Levels of Education and Experience Requested for Manufacturing and Production Occupation Job Postings in the Chicago Region, April 1, 2017–March 31, 2018" is a stacked bar chart, showing 9+ years of , 6 to 8 years of experience, 3 to 5 years of experience, 0 to 2 years of experience; with in the y-axis. The x-axis shows values from 0 to 3873.684210526316. The y-axis shows values from -0.5 to 4.5. This visualization has the following annotation: Source: Labor Insight Jobs (Burning Glass Technologies).