Edit chart
Loading graph
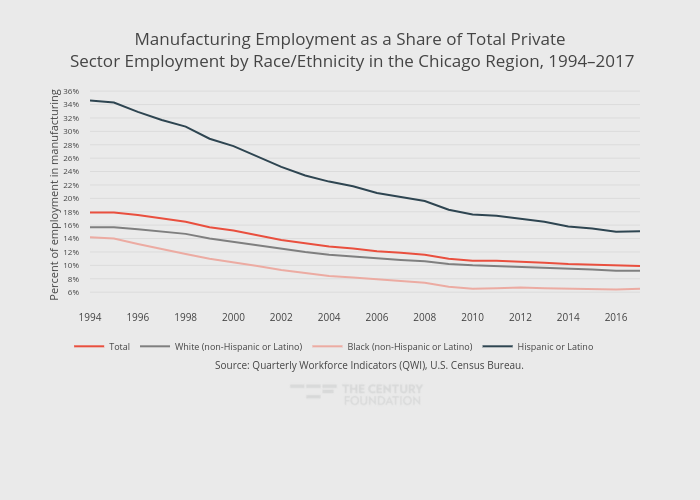
Thecenturyfoundation's interactive graph and data of "Manufacturing Employment as a Share of Total Private Sector Employment by Race/Ethnicity in the Chicago Region, 1994–2017" is a line chart, showing Total, White (non-Hispanic or Latino), Black (non-Hispanic or Latino), Hispanic or Latino; with in the x-axis and Percent of employment in manufacturing in the y-axis.. The x-axis shows values from 1994 to 2017. The y-axis shows values from 4.833333333333334 to 36.16666666666667. This visualization has the following annotation: Source: Quarterly Workforce Indicators (QWI), U.S. Census Bureau.