Edit chart
Loading graph
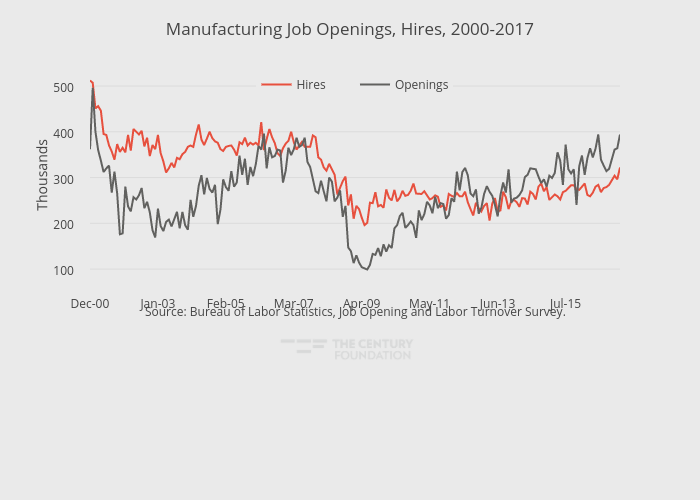
Thecenturyfoundation's interactive graph and data of "Manufacturing Job Openings, Hires, 2000-2017" is a line chart, showing Hires vs Openings; with in the x-axis and Thousands in the y-axis.. The x-axis shows values from 0 to 195. The y-axis shows values from 76.05555555555556 to 534.9444444444445. This visualization has the following annotation: Source: Bureau of Labor Statistics, Job Opening and Labor Turnover Survey.