Edit chart
Loading graph
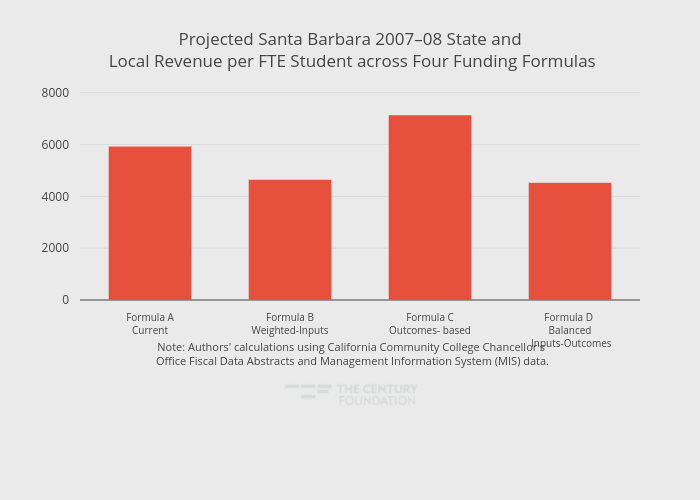
Thecenturyfoundation's interactive graph and data of "Projected Santa Barbara 2007–08 State and Local Revenue per FTE Student across Four Funding Formulas" is a bar chart, showing Percent Change December 2016/17; with in the x-axis. The x-axis shows values from -0.5 to 3.5. The y-axis shows values from 0 to 8100. This visualization has the following annotation: Note: Authors' calculations using California Community College Chancellor's Office Fiscal Data Abstracts and Management Information System (MIS) data.