Edit chart
Loading graph
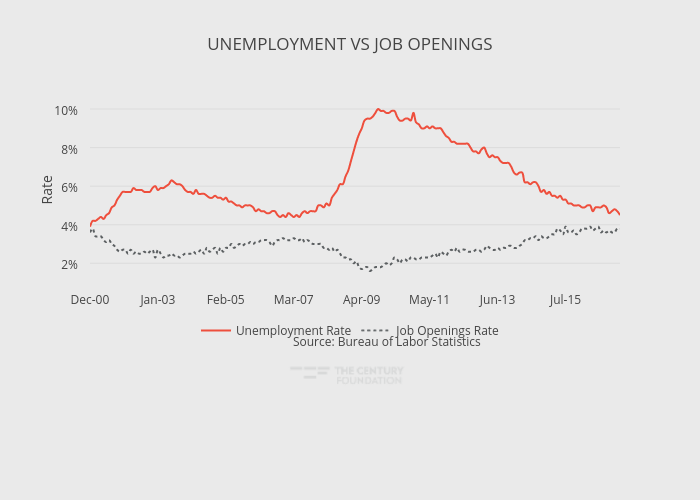
Thecenturyfoundation's interactive graph and data of "UNEMPLOYMENT VS JOB OPENINGS" is a line chart, showing Unemployment Rate vs Job Openings Rate; with in the x-axis and Rate in the y-axis.. The x-axis shows values from 0 to 195. The y-axis shows values from 1.1333333333333333 to 10.466666666666667. This visualization has the following annotation: Source: Bureau of Labor Statistics