Edit chart
Loading graph
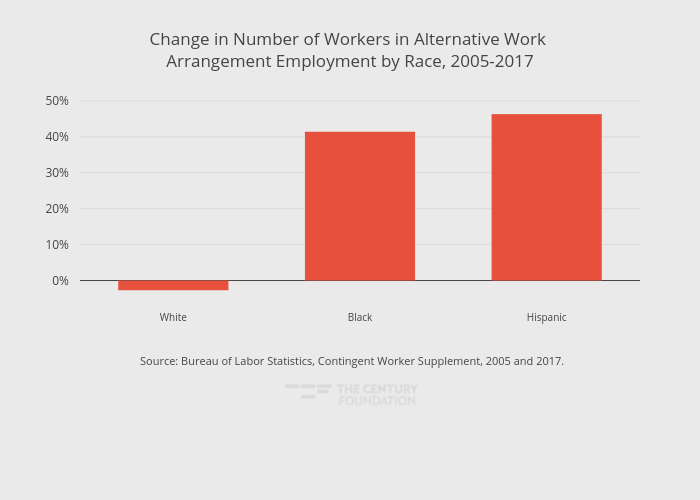
Thecenturyfoundation's interactive graph and data of "Change in Number of Workers in Alternative Work Arrangement Employment by Race, 2005-2017" is a bar chart, showing Percent Change December 2016/17; with in the x-axis. The x-axis shows values from -0.5 to 2.5. The y-axis shows values from -5.4222222222222225 to 53.02222222222222. This visualization has the following annotation: Source: Bureau of Labor Statistics, Contingent Worker Supplement, 2005 and 2017.