Edit chart
Loading graph
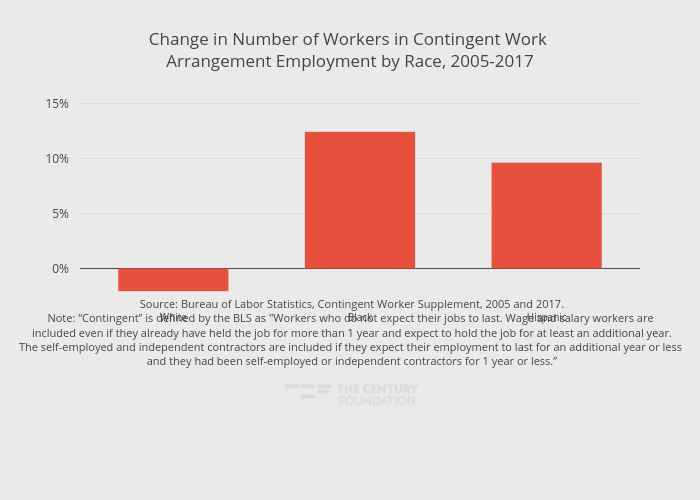
Thecenturyfoundation's interactive graph and data of "Change in Number of Workers in Contingent Work Arrangement Employment by Race, 2005-2017" is a bar chart, showing Percent Change December 2016/17; with in the x-axis. The x-axis shows values from -0.5 to 2.5. The y-axis shows values from -2.8615842121666666 to 16.228759611166666. This visualization has the following annotation: Source: Bureau of Labor Statistics, Contingent Worker Supplement, 2005 and 2017.Note: “Contingent” is defined by the BLS as "Workers who do not expect their jobs to last. Wage and salary workers are included even if they already have held the job for more than 1 year and expect to hold the job for at least an additional year. The self-employed and independent contractors are included if they expect their employment to last for an additional year or less and they had been self-employed or independent contractors for 1 year or less.”