Edit chart
Loading graph
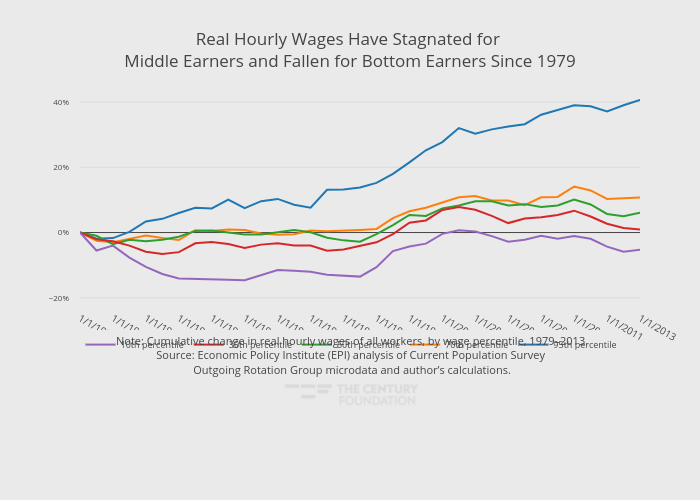
Thecenturyfoundation's interactive graph and data of "Real Hourly Wages Have Stagnated for Middle Earners and Fallen for Bottom Earners Since 1979" is a line chart, showing 95th percentile, 70th percentile, 50th percentile, 30th percentile, 10th percentile; with in the x-axis. The x-axis shows values from 0 to 34. The y-axis shows values from -20.666666666666668 to 43.66666666666667. This visualization has the following annotation: Note: Cumulative change in real hourly wages of all workers, by wage percentile, 1979–2013.Source: Economic Policy Institute (EPI) analysis of Current Population Survey Outgoing Rotation Group microdata and author’s calculations.