Edit chart
Loading graph
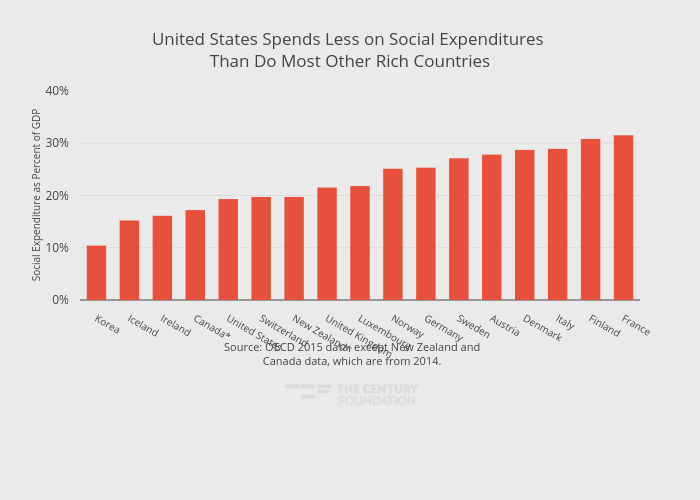
Thecenturyfoundation's interactive graph and data of "United States Spends Less on Social Expenditures Than Do Most Other Rich Countries" is a bar chart, showing 2015; with in the x-axis and Social Expenditure as Percent of GDP in the y-axis.. The x-axis shows values from -0.5 to 16.5. The y-axis shows values from 0 to 40.1578947368421. This visualization has the following annotation: Source: OECD 2015 data, except New Zealand and Canada data, which are from 2014.