Edit chart
Loading graph
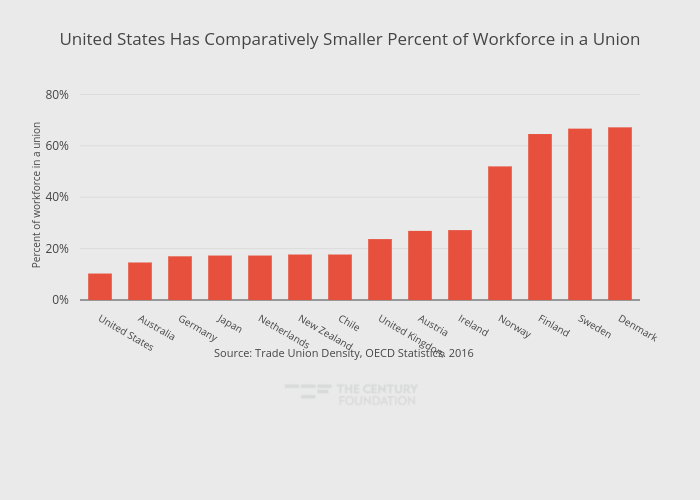
Thecenturyfoundation's interactive graph and data of "United States Has Comparatively Smaller Percent of Workforce in a Union" is a bar chart, showing 2016; with in the x-axis and Percent of workforce in a union in the y-axis.. The x-axis shows values from -0.5 to 13.5. The y-axis shows values from 0 to 81.73684210526316. This visualization has the following annotation: Source: Trade Union Density, OECD Statistics. 2016