Edit chart
Loading graph
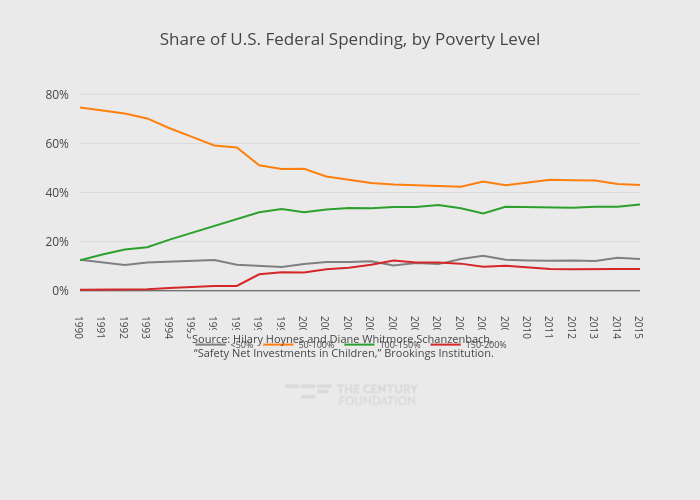
Thecenturyfoundation's interactive graph and data of "Share of U.S. Federal Spending, by Poverty Level" is a line chart, showing <50%, 50-100%, 100-150%, 150-200%; with in the x-axis. The x-axis shows values from 1990 to 2015. The y-axis shows values from -3.7577243677666674 to 81.74894190356667. This visualization has the following annotation: Source: Hilary Hoynes and Diane Whitmore Schanzenbach, “Safety Net Investments in Children,” Brookings Institution.