Edit chart
Loading graph
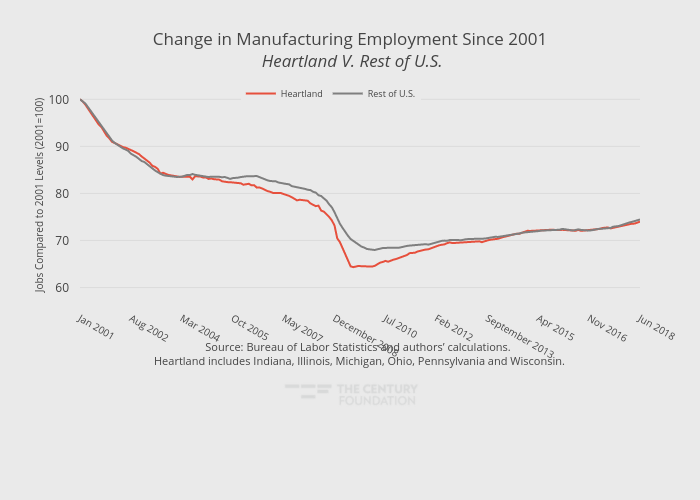
Thecenturyfoundation's interactive graph and data of "Change in Manufacturing Employment Since 2001 Heartland V. Rest of U.S." is a line chart, showing Heartland vs Rest of U.S.; with in the x-axis and Jobs Compared to 2001 Levels (2001=100) in the y-axis.. The x-axis shows values from 0 to 209. The y-axis shows values from 57.35441236222223 to 101.98134671777778. This visualization has the following annotation: Source: Bureau of Labor Statistics and authors’ calculations. Heartland includes Indiana, Illinois, Michigan, Ohio, Pennsylvania and Wisconsin.