Edit chart
Loading graph
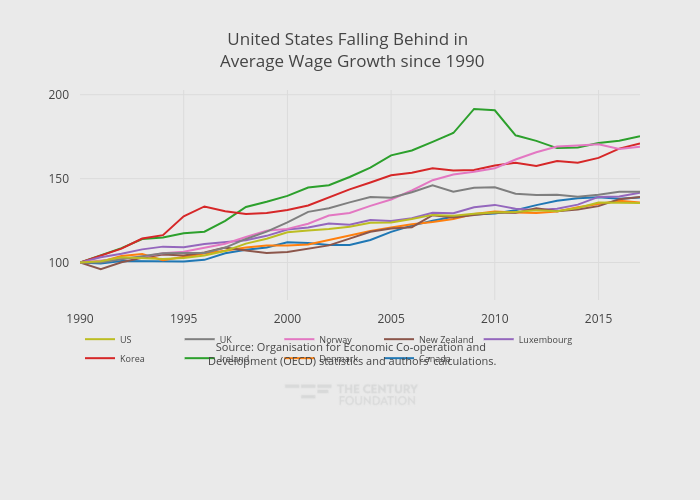
Thecenturyfoundation's interactive graph and data of "United States Falling Behind in Average Wage Growth since 1990" is a line chart, showing Canada, Denmark, Ireland, Korea, Luxembourg, New Zealand, Norway, UK, US. The x-axis shows values from 1990 to 2017. The y-axis shows values from 77.67321678722222 to 202.8. This visualization has the following annotation: Source: Organisation for Economic Co-operation and Development (OECD) statistics and authors’ calculations.