Edit chart
Loading graph
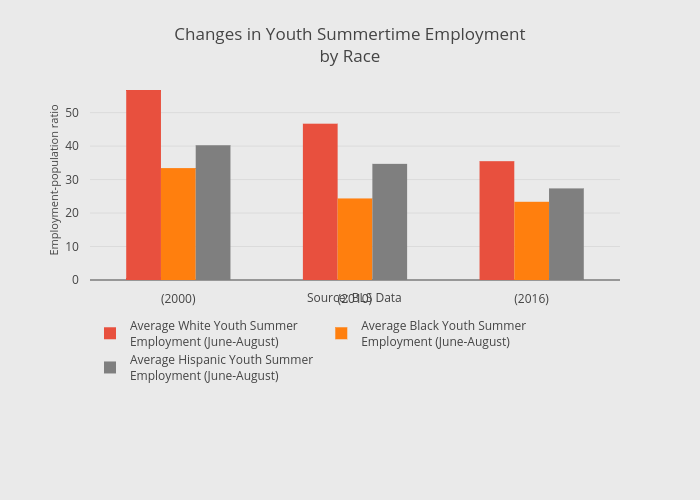
Thecenturyfoundation's interactive graph and data of "Changes in Youth Summertime Employmentby Race" is a bar chart, showing Average White Youth Summer Employment (June-August), Average Black Youth Summer Employment (June-August), Average Hispanic Youth Summer Employment (June-August); with in the x-axis and Employment-population ratio in the y-axis.. The x-axis shows values from -0.5 to 2.5. The y-axis shows values from 0 to 59.754385968421055. This visualization has the following annotation: Source: BLS Data