Edit chart
Loading graph
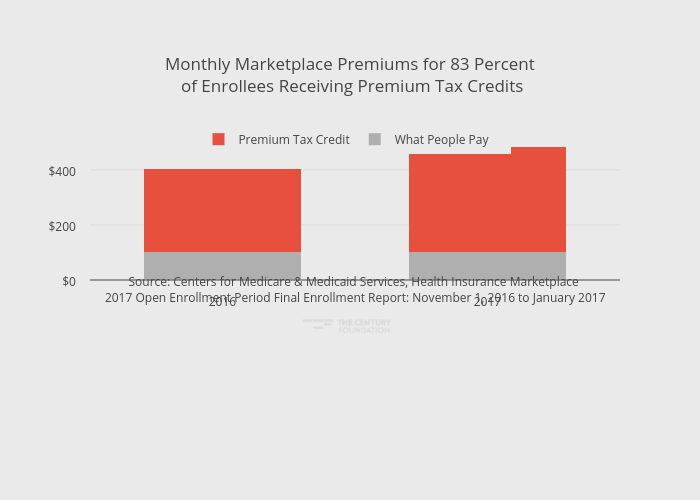
Thecenturyfoundation's interactive graph and data of "Monthly Marketplace Premiums for 83 Percent of Enrollees Receiving Premium Tax Credits" is a stacked bar chart, showing What People Pay vs Premium Tax Credit; with in the x-axis. The x-axis shows values from 2015.5 to 2017.5. The y-axis shows values from 0 to 508.42105263157896. This visualization has the following annotation: Source: Centers for Medicare & Medicaid Services, Health Insurance Marketplace 2017 Open Enrollment Period Final Enrollment Report: November 1, 2016 to January 2017