Edit chart
Loading graph
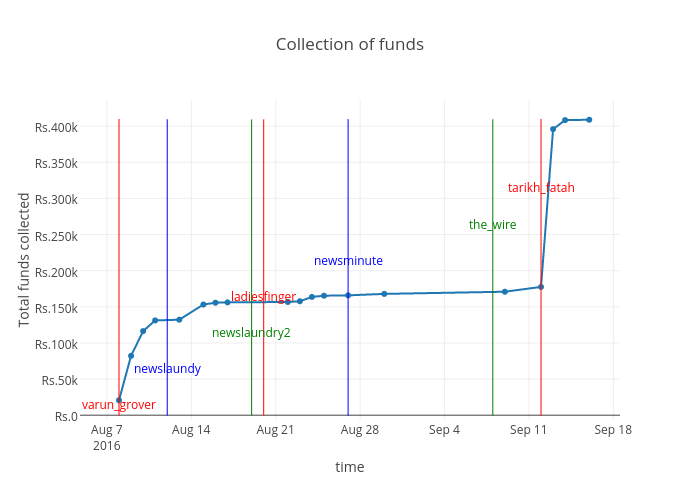
Thekindlyone's interactive graph and data of "Collection of funds" is a scatter chart; with time in the x-axis and Total funds collected in the y-axis.. The x-axis shows values from 0 to 0. The y-axis shows values from 0 to 0. This visualization has the following annotations: varun_grover; newslaundy; newslaundry2; ladiesfinger; newsminute; the_wire; tarikh_fatah