Edit chart
Loading graph
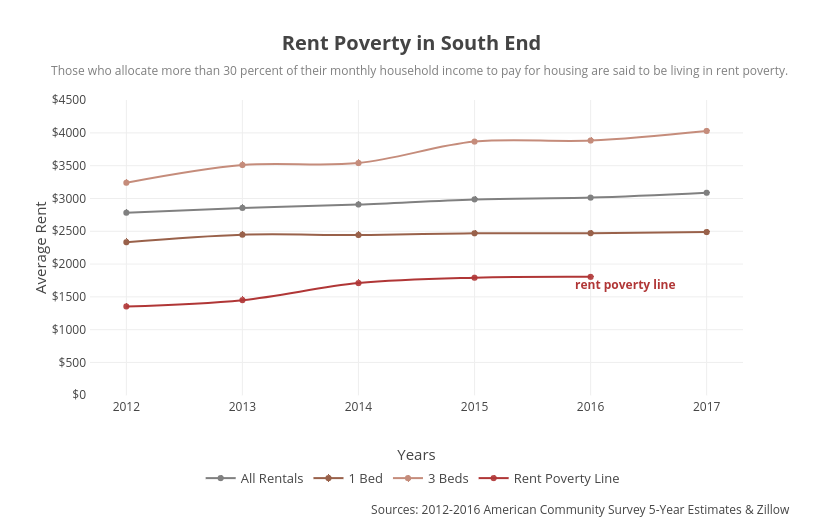
Tian.yuan1's interactive graph and data of "Rent Poverty in South End" is a line chart, showing All Rentals, 1 Bed, 3 Beds, Rent Poverty Line; with Years in the x-axis and Average Rent in the y-axis.. The x-axis shows values from 2011.6868094509605 to 2017.3131905490395. The y-axis shows values from 0.004500000000000003 to 4499.999999999998. This visualization has the following annotations: Sources: 2012-2016 American Community Survey 5-Year Estimates & Zillow; rent poverty line; Those who allocate more than 30 percent of their monthly household income to pay for housing are said to be living in rent poverty.