Edit chart
Loading graph
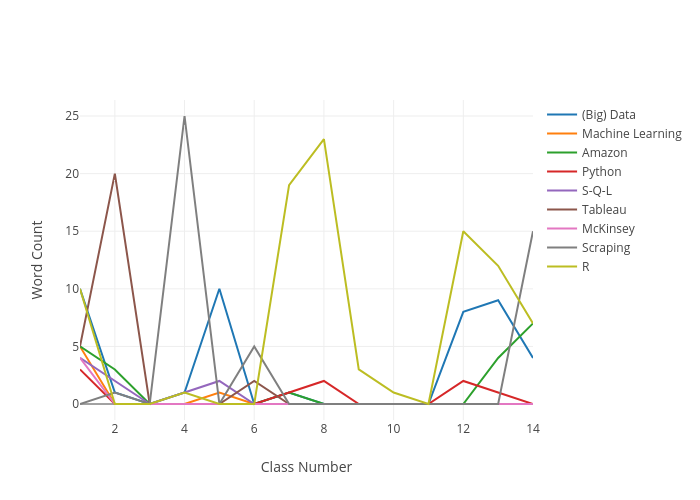
Tifchang's interactive graph and data of "Word Count vs Class Number" is a line chart, showing (Big) Data, Machine Learning, Amazon, Python, S-Q-L, Tableau, McKinsey, Scraping, R; with Class Number in the x-axis and Word Count in the y-axis.. The x-axis shows values from 1 to 14. The y-axis shows values from -1.388888888888889 to 26.38888888888889.