Edit chart
Loading graph
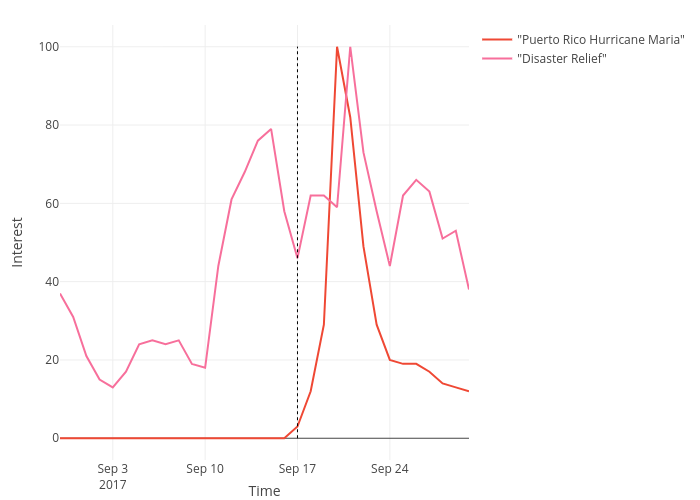
Tifchang's interactive graph and data of "Interest vs Time" is a line chart, showing "Puerto Rico Hurricane Maria" vs "Disaster Relief"; with Time in the x-axis and Interest in the y-axis.. The x-axis shows values from 0 to 0. The y-axis shows values from 0 to 0.