Edit chart
Loading graph
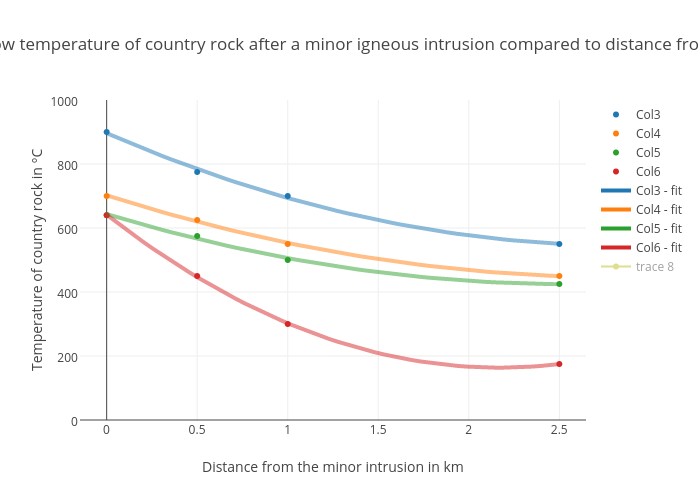
Timtjtim's interactive graph and data of "Graph to show temperature of country rock after a minor igneous intrusion compared to distance from the pluton" is a scatter chart, showing Col3, Col4, Col5, Col6, Col3 - fit, Col4 - fit, Col5 - fit, Col6 - fit, trace 8; with Distance from the minor intrusion in km in the x-axis and Temperature of country rock in °C in the y-axis.. The x-axis shows values from -0.14715805350480277 to 2.647158053504803. The y-axis shows values from 0 to 1000.