Edit chart
Loading graph
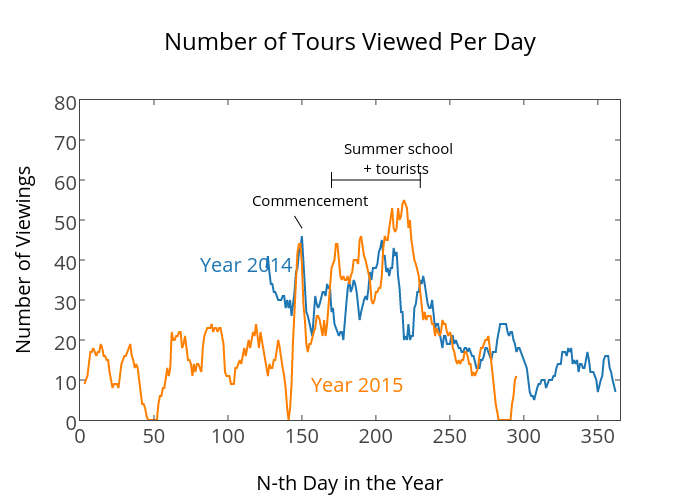
Ting.yuansen's interactive graph and data of "Number of Tours Viewed Per Day" is a line chart, showing (Date,Viewings), (Date,Viewings), Commencement, Summer school + Tourists, Summer school + Tourists, Summer school + Tourists. The x-axis shows values from 0 to 0. The y-axis shows values from 0 to 0. This visualization has the following annotations: Commencement; Summer school + tourists; Year 2014; Year 2015