Edit chart
Loading graph
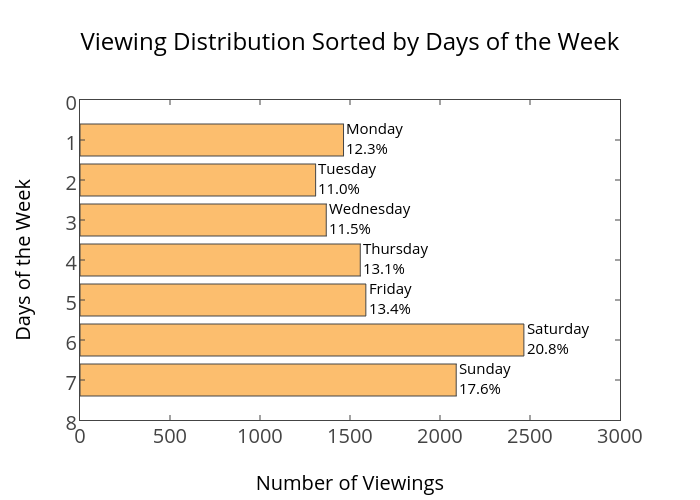
Ting.yuansen's interactive graph and data of "Viewing Distribution Sorted by Days of the Week" is a bar chart. The x-axis shows values from 0 to 0. The y-axis shows values from 0 to 0. This visualization has the following annotations: Monday 12.3%; Tuesday 11.0%; Wednesday 11.5%; Thursday 13.1%; Friday 13.4%; Saturday 20.8%; Sunday 17.6%