Edit chart
Loading graph
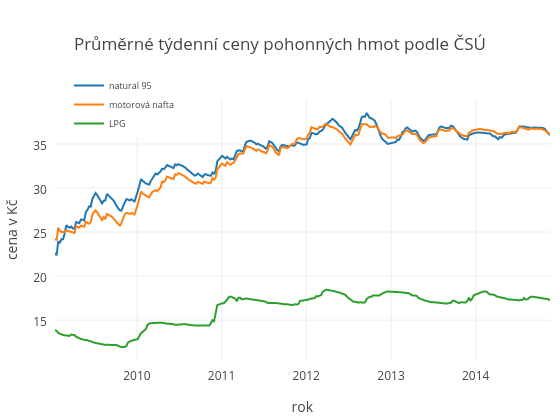
Tocit's interactive graph and data of "Průměrné týdenní ceny pohonných hmot podle ČSÚ" is a line chart, showing natural 95, motorová nafta, LPG; with rok in the x-axis and cena v Kč in the y-axis.. The x-axis shows values from 1231714800000 to 1416178800000. The y-axis shows values from 10.474444444444444 to 39.98555555555556. This visualization has the following annotation: