Edit chart
Loading graph
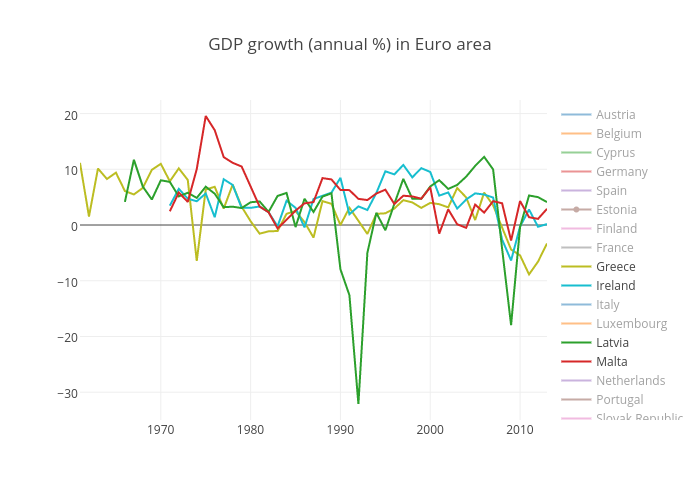
Tomasp's interactive graph and data of "GDP growth (annual %) in Euro area" is a scatter chart, showing Austria, Belgium, Cyprus, Germany, Spain, Estonia, Finland, France, Italy, Luxembourg, Netherlands, Portugal, Slovak Republic, Slovenia. The x-axis shows values from 0 to 0. The y-axis shows values from 0 to 0.