Edit chart
Loading graph
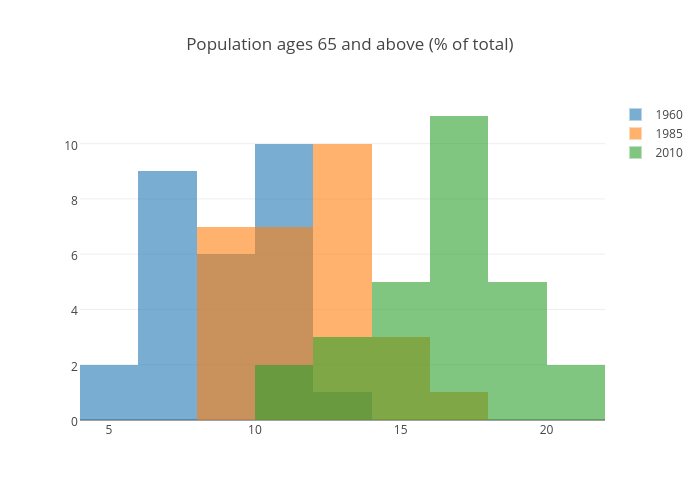
Tomasp's interactive graph and data of "Population ages 65 and above (% of total)" is a histogram, showing 1960, 1985, 2010. The x-axis shows values from 0 to 0. The y-axis shows values from 0 to 0.