Edit chart
Loading graph
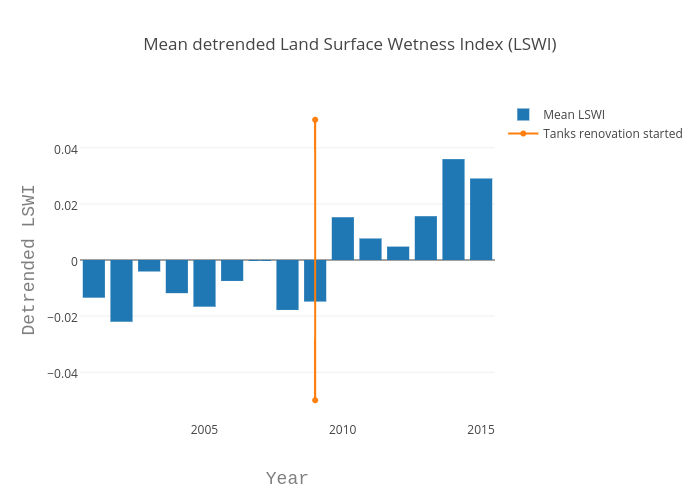
Tomersk's interactive graph and data of "Mean detrended Land Surface Wetness Index (LSWI)" is a bar chart, showing Mean LSWI vs Tanks renovation started; with Year in the x-axis and Detrended LSWI in the y-axis.. The x-axis shows values from 0 to 0. The y-axis shows values from 0 to 0.