Edit chart
Loading graph
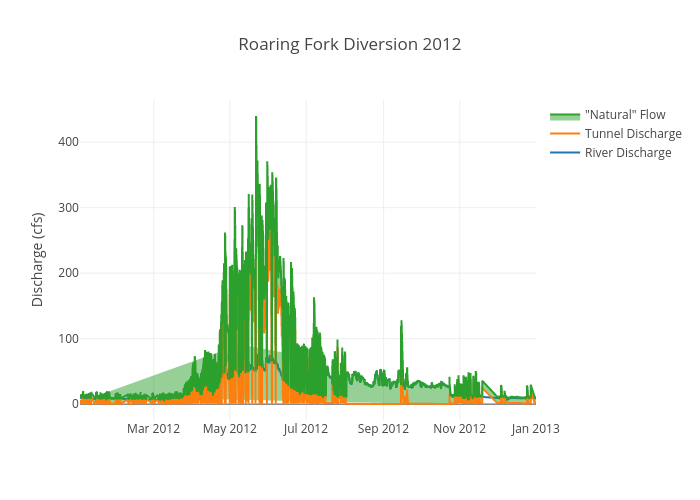
Tony.cannistra's interactive graph and data of "Roaring Fork Diversion 2012" is a scatter chart, showing River Discharge, Tunnel Discharge, "Natural" Flow; with Discharge (cfs) in the y-axis. The x-axis shows values from 0 to 0. The y-axis shows values from 0 to 0.