Edit chart
Loading graph
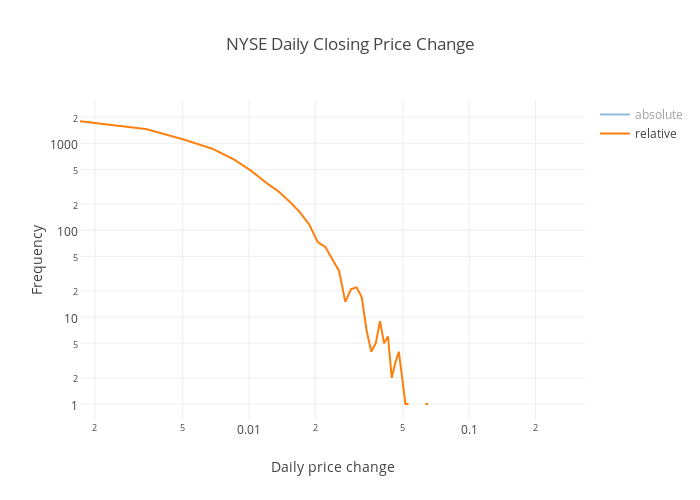
Toz's interactive graph and data of "NYSE Daily Closing Price Change" is a scatter chart, showing absolute vs relative; with Daily price change in the x-axis and Frequency in the y-axis.. The x-axis shows values from -2.7666503895854793 to -0.47439431822900324. The y-axis shows values from -0.18413884599850847 to 3.4986380739716596.