Edit chart
Loading graph
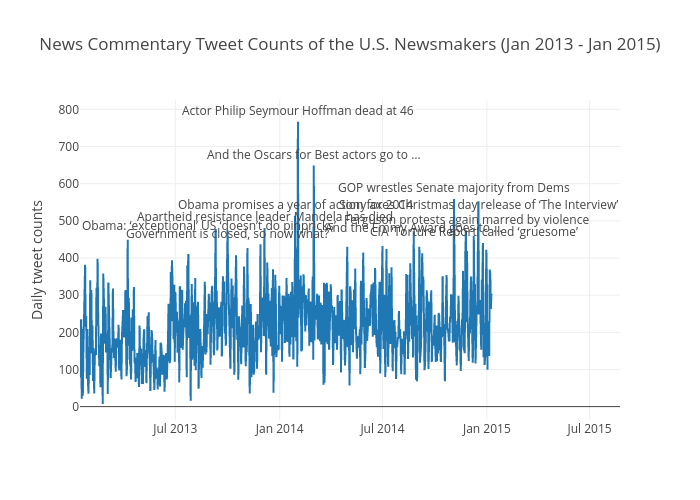
Toz's interactive graph and data of "News Commentary Tweet Counts of the U.S. Newsmakers (Jan 2013 - Jan 2015)" is a scatter chart; with time in the x-axis and Daily tweet counts in the y-axis.. The x-axis shows values from 1358139600000 to 1424808783596.2146. The y-axis shows values from -35.434816702607336 to 813.2615173495393. This visualization has the following annotations: Apartheid resistance leader Mandela has died; Obama promises a year of action for 2014; Actor Philip Seymour Hoffman dead at 46; Obama: ‘exceptional’ US ‘doesn’t do pinpricks’; Sony axes Christmas day release of ‘The Interview’; CIA ‘Torture Report’ called ‘gruesome’; And the Oscars for Best actors go to …; And the Emmy Award goes to …; GOP wrestles Senate majority from Dems; Government is closed, so now what?; Ferguson protests again marred by violence