Edit chart
Loading graph
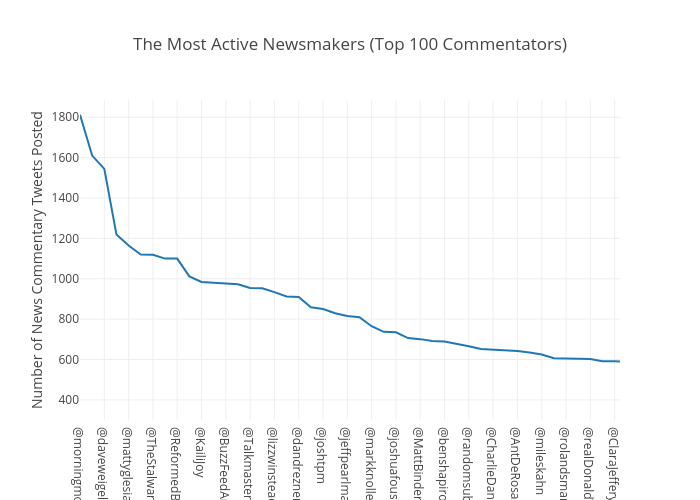
Toz's interactive graph and data of "The Most Active Newsmakers (Top 100 Commentators)" is a scatter chart, showing Number of News Commentary Tweets Posted; with Number of News Commentary Tweets Posted in the y-axis. The x-axis shows values from 0 to 44.44310631229236. The y-axis shows values from 300.44444444444446 to 1885.4710006373489.