Edit chart
Loading graph
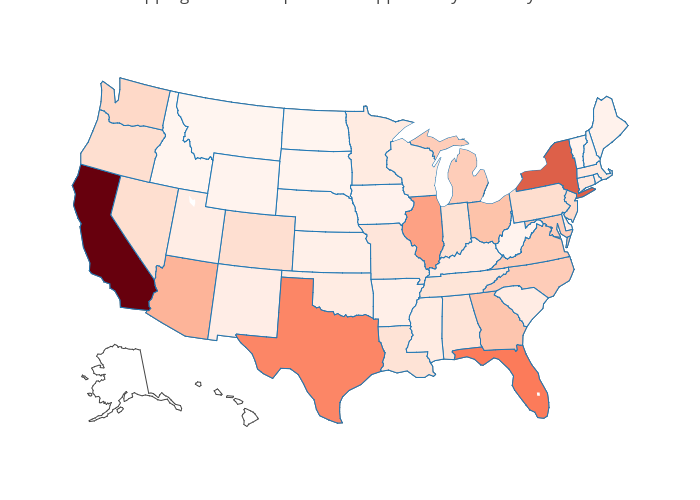
Trepp_dylanwall's interactive graph and data of "Mapping of CMBS Exposure in Opportunity Zones by State" is a choropleth. The x-axis shows values from 0 to 0. The y-axis shows values from 0 to 0.