Edit chart
Loading graph
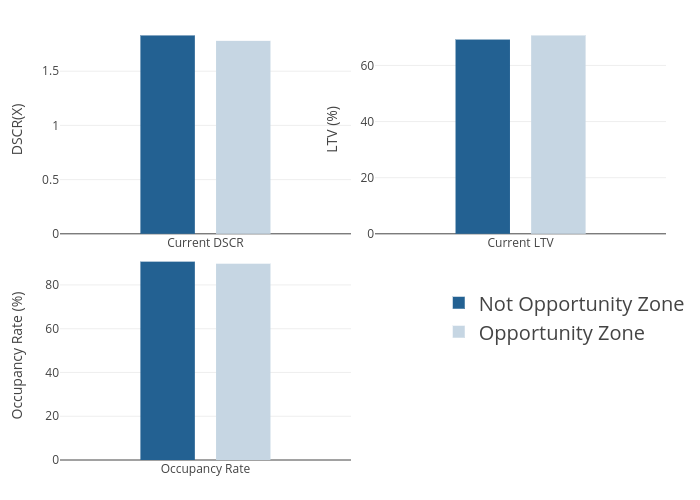
Trepp_dylanwall's interactive graph and data of "Not Opportunity Zone, Opportunity Zone, Not Opportunity Zone, Opportunity Zone, Not Opportunity Zone, Opportunity Zone" is a bar chart, showing Not Opportunity Zone, Opportunity Zone, Not Opportunity Zone, Opportunity Zone, Not Opportunity Zone, Opportunity Zone; with DSCR(X) in the y-axis. The x-axis shows values from -0.5 to 0.5. The y-axis shows values from 0 to 1.9263157894736842.