Edit chart
Loading graph
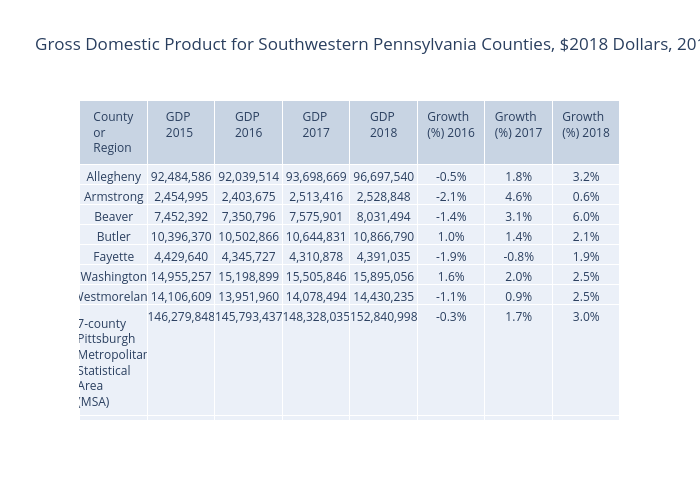
Ucsur's interactive graph and data of "Gross Domestic Product for Southwestern Pennsylvania Counties, $2018 Dollars, 2015-2018" is a table. The x-axis shows values from -1 to 6. The y-axis shows values from -1 to 4.