Edit chart
Loading graph
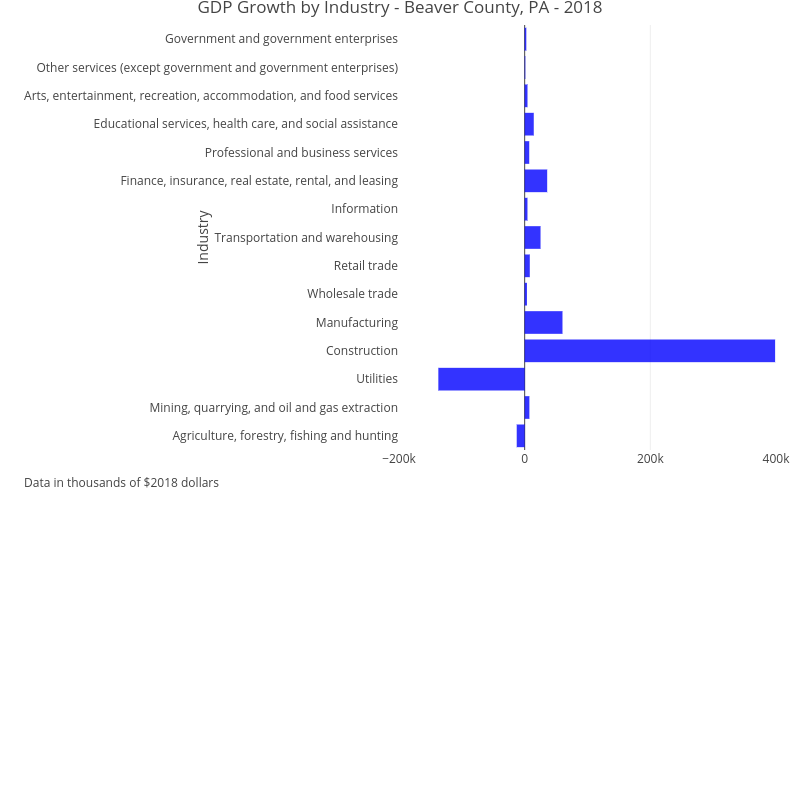
Ucsur's interactive graph and data of "GDP Growth by Industry - Beaver County, PA - 2018" is a bar chart, showing No Name; with Industry in the y-axis. The x-axis shows values from -200000 to 400000. The y-axis shows values from 0 to 0. This visualization has the following annotation: Data in thousands of $2018 dollars