Edit chart
Loading graph
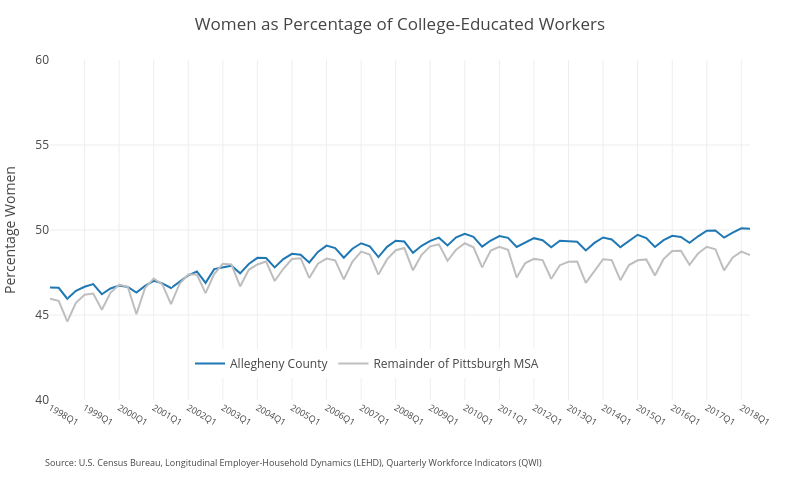
Ucsur's interactive graph and data of "Women as Percentage of College-Educated Workers" is a line chart, showing Allegheny County vs Remainder of Pittsburgh MSA; with Percentage Women in the y-axis. The x-axis shows values from 0 to 0. The y-axis shows values from 40 to 60. This visualization has the following annotation: Source: U.S. Census Bureau, Longitudinal Employer-Household Dynamics (LEHD), Quarterly Workforce Indicators (QWI)