Edit chart
Loading graph
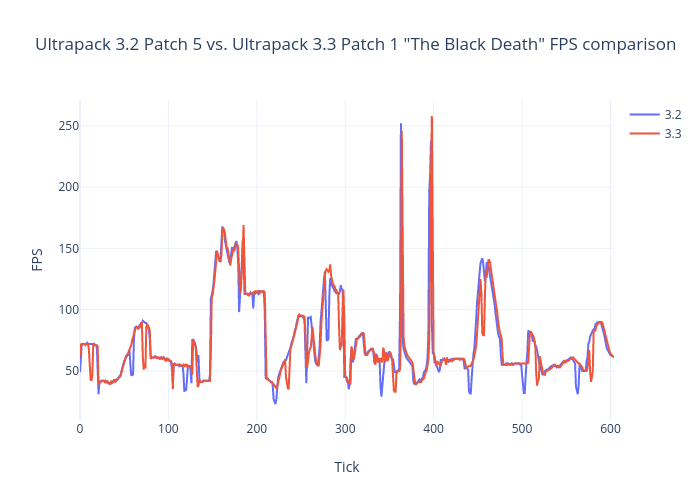
Umfegumfe's interactive graph and data of "Ultrapack 3.2 Patch 5 vs. Ultrapack 3.3 Patch 1 "The Black Death" FPS comparison" is a line chart, showing 3.2 vs 3.3; with Tick in the x-axis and FPS in the y-axis.. The x-axis shows values from 0 to 604. The y-axis shows values from 9.944444444444443 to 271.05555555555554.