Edit chart
Loading graph
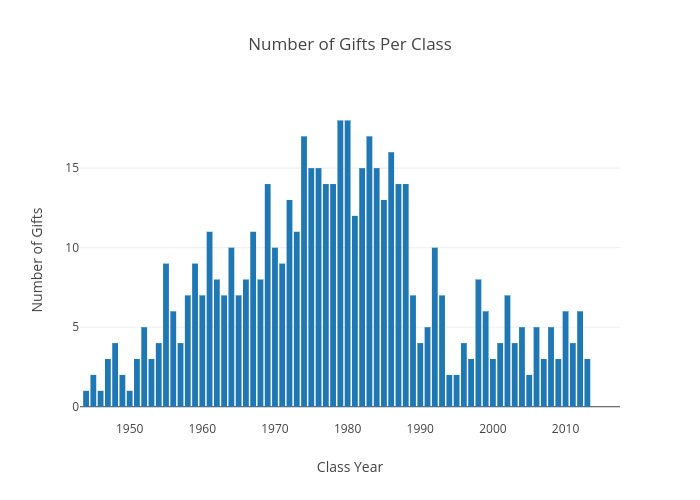
Umsod's interactive graph and data of "Number of Gifts Per Class" is a bar chart, showing Col2; with Class Year in the x-axis and Number of Gifts in the y-axis.. The x-axis shows values from 1943.1641040119482 to 2017.4926622701234. The y-axis shows values from -0.834411981395645 to 19.284596268937488.