Edit chart
Loading graph
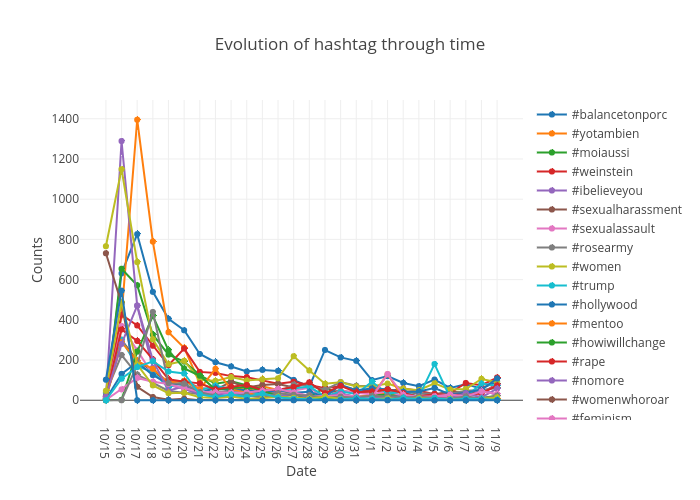
Unguyen's interactive graph and data of "Evolution of hashtag through time" is a line chart, showing #balancetonporc, #yotambien, #moiaussi, #weinstein, #ibelieveyou, #sexualharassment, #sexualassault, #rosearmy, #women, #trump, #hollywood, #mentoo, #howiwillchange, #rape, #nomore, #womenwhoroar, #feminism, #himthough, #yesallwomen, #quellavoltache, #quemangalicia; with Date in the x-axis and Counts in the y-axis.. The x-axis shows values from -1.8096918574625578 to 26.809691857462557. The y-axis shows values from -96.97236180904521 to 1491.9723618090452.