Edit chart
Loading graph
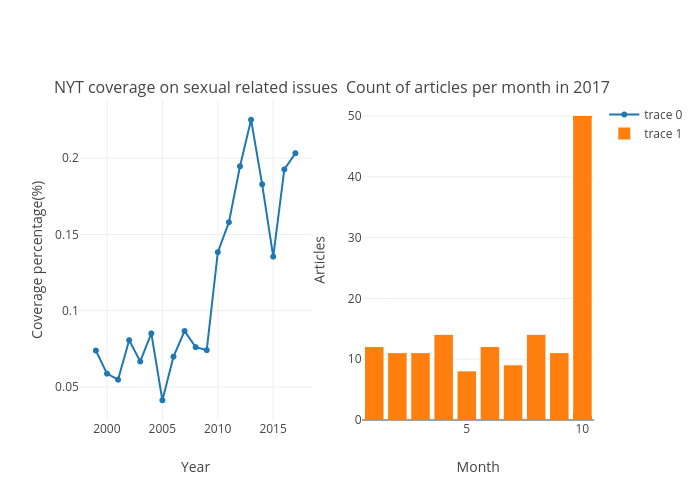
Unguyen's interactive graph and data of "Coverage percentage(%) vs Year" is a scatter chart; with Year in the x-axis and Coverage percentage(%) in the y-axis.. The x-axis shows values from 1997.6919800540204 to 2018.3080199459796. The y-axis shows values from 0.0285916290330162 to 0.23792147627221333. This visualization has the following annotations: NYT coverage on sexual related issues; Count of articles per month in 2017